This project hosted a demonstration of the operation and function of the autonomous truck-mounted attenuator (ATMA) in a closed loop environment as well as in an active work zone. This will provide a hands-on opportunity for stakeholders to experience this state-of-the-art equipment. ATMA has the potential to reduce the risk involved in roadway construction and maintenance. The demonstration has also tested the feasibility of the technology and its application for falling weight deflectometer equipment. For more information, please contact Dr. Nithin Agarwal at nithin.agarwal@ufl.edu.
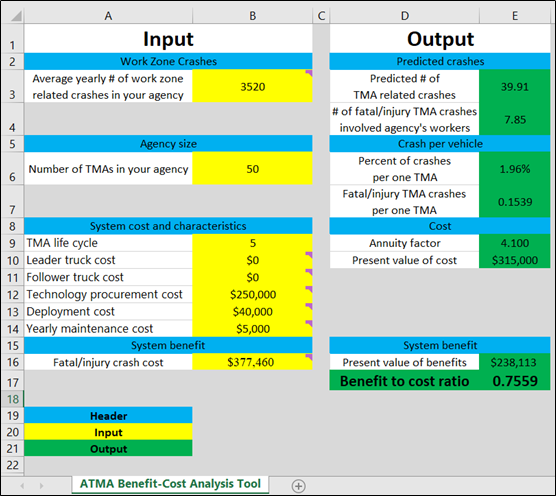
Project Final Report & Benefit Cost (BC) Analysis Tool: A spreadsheet tool was developed as part of this study. Click the link below to download the BC tool.
Project Final Report –Download
Data conflation and visualization
| Sample Video | ||
| Additional Information | Subplots | Objectives |
| Dashcam video | Establishes ground truth – the video provides an opportunity for the analyst to visually inspect and correlate the traffic characteristics (speed, acceleration, etc.) with the data log retrieved from ATMA. | |
| GPS position of vehicles in road network | Provides location of vehicles (points) on primary road network (lines) for visual inspection. It helps to qualitatively understand the impact of road network elements such as intersection etc. | |
| Time and status | Since several equipment are used in the data collection effort, this plot helps in reviewing the time component and the associated status of the follower ATMA. Info on different navigation status can be found in the final report. | |
| Speed vs time and distance vs time plot | These plots quantify the instantaneous speed and distance travelled of leader and follower with respect to time. |
CLOSED LOOP TESTS
| Test ID | Tittle |
|---|---|
| TC1 | Automatic stop (A-Stop) - Leader Vehicle Internal Button (OCU) |
| TC2 | Emergency Stop - ATMA Internal Button (OCU) |
| TC3 | Emergency Stop ATMA External Button |
| TC4 | Emergency Stop – Leader Independent E-Stop Button (Initiator) |
| TC5 | Follow Distance Set by User Interface (UI) Panel |
| TC6 | Following Accuracy on Straight Line (A&H) |
| TC7 | Following Accuracy on Slalom Course (A&H) |
| TC8 | Lane Changing Accuracy (A&H) |
| TC9 | Lateral offset |
| TC10 | Minimum Turn Radius |
| TC11 | Simple Curve (A&H) |
| TC12 | Roundabouts |
| TC13 | U-turns |
| TC14 | Bump Test |
| TC15 | Obstacle Detection – FRONT |
| TC16 | Vehicle Intrusion |
| TC17 | Object Recognition |
| TC18 | Speed Test (A&H) |
| TC19 | Braking – Leader Vehicle (A&H) |
| TC20 | ATMA Human Driver Takeover (A&H) |
| TC21 | Leader Reverse |
| TC22 | Acceleration/Deceleration |
| TC23 | Loss of Sensor (RADAR, LIDAR) |
| TC24 | Loss of GPS |
| TC25 | Loss of Communication (Single V2V Radio) |
| TC26 | Loss of Communication (Both V2V Radios) |
SUMMARY OF TEST SITES
| Test ID | SR/Interstate | Roadway ID | Milepost | Annual Average Daily Traffic (AADT) |
|---|---|---|---|---|
| FT-1 | US-441 | 26010000 | 7.700 to 9.700 | 13,900 |
| FT-2 | I-75 | 26260000 | 10.500 to 12.500 | 73,203 |
| FT-3 | SR-222 | 26005000 | 6.500 to 8.000 | 22,914 |
| FT-4 | SR-26 | 26130000 | 6.400 to 8.000 | 10,788 |
| FT-5 | SW 2nd Ave | - | - | 7,651 |
| FT-6 | SR-24 Waldo Rd | - | - | 16,273 |